

Climate change and natural disasters increasingly affect people’s well-being and development prospects. A recent World Bank study shows that climate change may cause 216 million people to migrate in their own country by 2050, and push as many as 132 million people into poverty by 2030.
Fragile contexts such as Somalia have recently faced cyclical climate-induced shocks from drought, to flooding and locust infestations. Because of Somalia’s economy reliance on natural resources and man-made degradation of natural resources such as charcoal production and overgrazing, climate change could make the country more vulnerable to poverty and food insecurity.
Greater drought exposure tends to decrease consumption by a significant margin in rural Somalia, increasing the poverty levels. This adverse impact of climate change on the poor will be far-reaching.
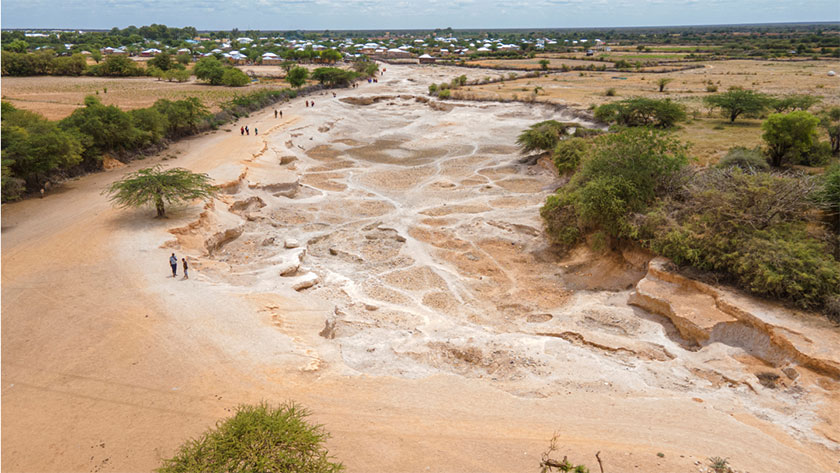
The recent drought in Somalia was among the most devastating. Following news about numerous livestock deaths from shortage of water, grim stories of human suffering started to emerge.
As of mid-December, there were reports of people, mostly children, dying due to a calamitous drought in central Somalia as well as a veritable exodus of people fleeing the drought to urban centers.

Connecting humanitarian and development
A large portion of Somalia is already vulnerable to economic shocks, given that 69% live below the international poverty line. Since natural disasters disproportionately affect the poor, perhaps we need to go beyond humanitarian responses and approach this problem from a development angle. How can Somalia adapt to climate change and shield its population from the negative impacts of climate change?
The World Bank’s Poverty Group has created a database of numerous subnational socio-economic and climate risk indicators drawn from multiple different sources to pinpoint high-risk disaster hotspots in Somalia where the adverse impact of natural disasters will be particularly high on the poor.
Traditionally, natural disasters like droughts do not prevail uniformly across the entire area of Somalia but only in some hotspots. Despite the scarcity of data coupled with methodological challenges to quantify such risks, a rapidly increasing repository of subnational data on climate risks and other socio-economic outcomes provides a new window of opportunities to enhance our understanding of climate and natural disaster risks and how they may affect the poor. These geospatial indicators are readily available from the World Bank online geospatial database.
Here is a quick and simple exercise of how subnational and geospatial data on drought risks and other socio-economic outcomes can be harnessed to identify disaster hotspots.
Panel A shows the percent of population exposed to high risks of food insecurity caused by the recent drought, according to the latest Integrated Food Security Phase Classifcation report while Panel B presents the regional poverty estimates based on Wave 2 of the Somalia High Frequency Survey (SHFS).
It is worth highlighting that the regions projected to be most affected by droughts include some of the poorest parts of Somalia, including Bay, Sanaag, Sool, and Nugaal.
To make these data easier to digest for development practitioners, the drought risks data from panel A has been combined with the poverty level from panel B, and then ranked by severity to highlight priority areas for action.
This composite index, commonly known as the Project Targeting Index, is shown in panel C; areas with darker colors represent higher priority for action.
| A) IPC Acute Food Insecurity Situation July – Projection for April – June 2022 | B) Monetary poverty estimates | C) Priority areas to mitigate the adverse impact of the recent drought on the poor |
 |
 |
 |
| Sources: Panel A shows the percentage of people high levels of acute food insecurity (IPC Phase 3 or above) based on the latest IPC report ); Panel B staff calculation from Wave 2 of the Somalia High Frequency Survey. Panel C shows the priority ranking of regions based on a composite index of drought risks (Panel A) and regional poverty (Panel B) constructed by using the PTI methodology where darker blues indicate higher priority. Note that the regional poverty rates are estimated based on areas that were safe enough to survey. It does not include areas which were inaccessible due to insecurity and Middle Juba was not covered in the SHFS for that reason. |
But, of course, more can be done to incorporate the long-term risks of drought into development work. Since climate risks are multidimensional and their definitions may depend on assumptions, there needs to be a tool for project teams to flexibly adjust those assumptions and combine multidimensional risks into one useful index.
In fact, there is an initial process of thinking about climate impacts and development risks, a building block of a new core diagnostic tool, the Country Climate and Development Report (CCDR).
A few questions will be answered with these data; for example, how does climate change threaten poverty eradication and the achievement of development goals in this country? And, how resilient are the country’s economy and public finances to natural disasters and climate change? Let us know in the comment below what areas should be looked at and what sources of data could be combined into the online geospatial dashboard.